

by Brian Barry, Bradley Voytek, Richard Gao (Voytek Lab @ University of California San Diego) – Email us!

Critical systems display scale-free temporal and spatial correlations, reflected in power law distributions of avalanche size and duration with related exponents. The power laws in such instances relate to each other in both time and space. A canonical example is from Bak, Tang, and Wiesenfeld’s paper on self organized criticality, in which they simulate an abelian sandpile model, yielding these distributions of sand ‘island’ size and duration.
It is known that neuronal avalanches demonstrate such behavior. In addition, neural time series have power law power spectral densities (hereby referred to as power spectra) Population codes (eigenvalue spectra from PCA) also have power law structure, as exemplified in Stringer et al.’s paper “High-dimensional geometry of population responses in visual cortex”. Given these statistics, we want to know whether the power law exponents of power spectra and eigenvalue spectra from neural data are related.

To investigate this, we used neural population data from another Stringer et al. work, where 8 Neuropixels probes recorded 10 brain regions on 3 mice. These mice were in the dark without sensory input and displayed a large range of neural activity (sometimes more than during sensory input), which could be related to ongoing behavioral states.
First we separated the data by mouse and region. Then, for each mouse-region pair, we take increasing subsets of random neurons, and decompose each subset using PCA to yield the eigenvalue spectrum and FFT for the power spectrum. For the power spectrum, all the neural spikes are summed before computing the spectrum in order to obtain a population vector. Using an in house spectral parameterization tool (FOOOF; which is open source), we fit power exponents for each spectra. For each subset this is done for many iterations in order to avoid bias.
For some additional statistics, we calculate average exponents for the spectra, and compute correlation between components.
To answer our original question, we compute the correlation (with both Spearman and Pearson methods) between the PSD and eigenspectrum exponents. This entire analysis is then repeated for several trials.
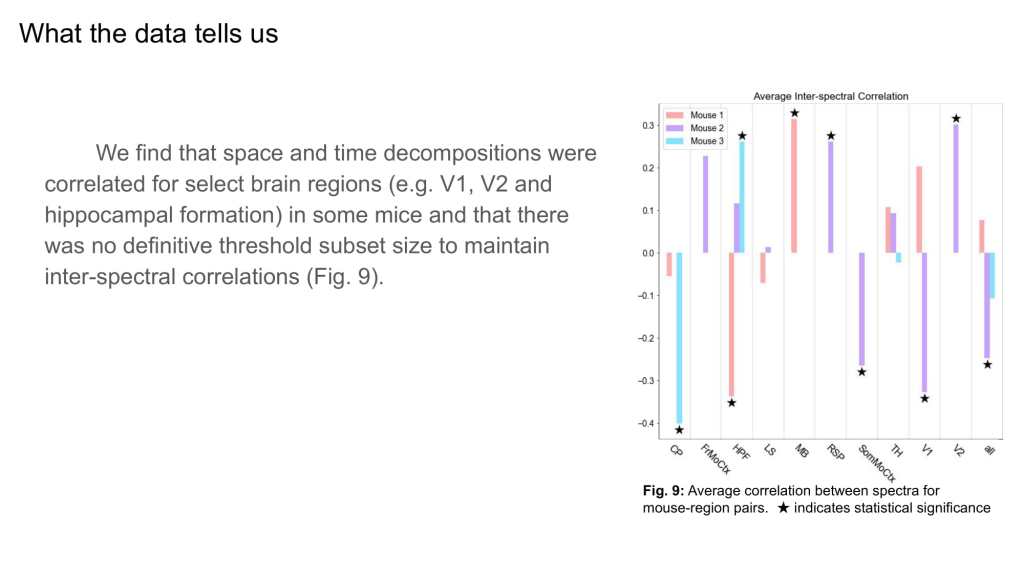
We find that space and time decompositions were correlated for select brain regions in only some mice and that there was no definitive threshold subset size to maintain inter-spectral correlations. The figure displays the average correlation (across subset sizes) between the two spectral exponents of interest for different mouse-region pairs. Note that some mice did not have recordings in certain regions.

We wanted to compare our results to a ground truth model. We simulated “neural data” by generating multiple independent series of colored noise (which in some instances is similar to fractional brownian motion) with varying power law exponents/fractal dimensions.
It is known that power spectra of such self affine processes are power law-obeying.
For each exponent (which corresponds to a PSD shape), we perform PCA on all the series to yield the eigenspectrum, similarly to the previous pipeline with neural data.
We compare the colored noise PSD exponent with the computed eigenspectrum exponent, and find that eigenspectra obey a power law. This is interesting because even though the series are independent and thus not critical a power law is still visible. Furthermore, it is highly correlated with PSD exponents of simulated data.
This suggests that low-dimensional (typically power law obeying) neural manifolds can arise purely as a result of the temporal statistics of potentially independent neuronal activity, thus calling for more robust measures of neural manifolds and criticality in the brain